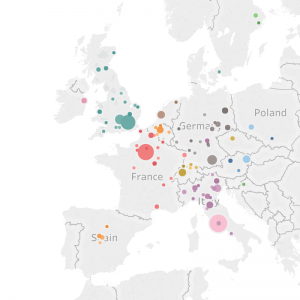
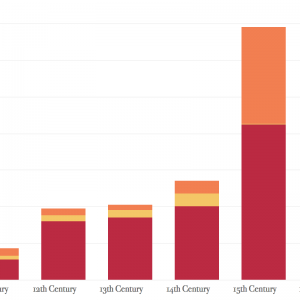
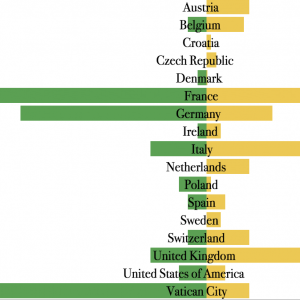
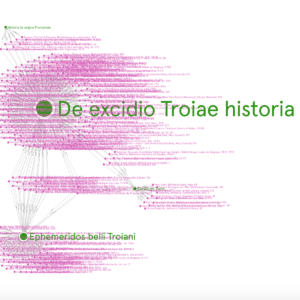
Below are a series of visualisations that showcase the different ways of reading the data collected as part of the “Transtextual Networks” project. All the visualisations are interactive and open access, and the data used to create them are also available as part of the visualisations.


